

Documents, Spreadsheets & Diagrams
Ayunis Core can create three types of artifacts directly in the chat: documents, spreadsheets, and diagrams. All open in a side panel to the right of the chat, where you can review, refine, and export them.
Documents
Section titled “Documents”Edit, format, and export AI-generated documents as Word or PDF files – directly from the chat, without switching applications. Turn a chat response into a ready-to-send letter, a polished report, or a statement in just a few clicks.
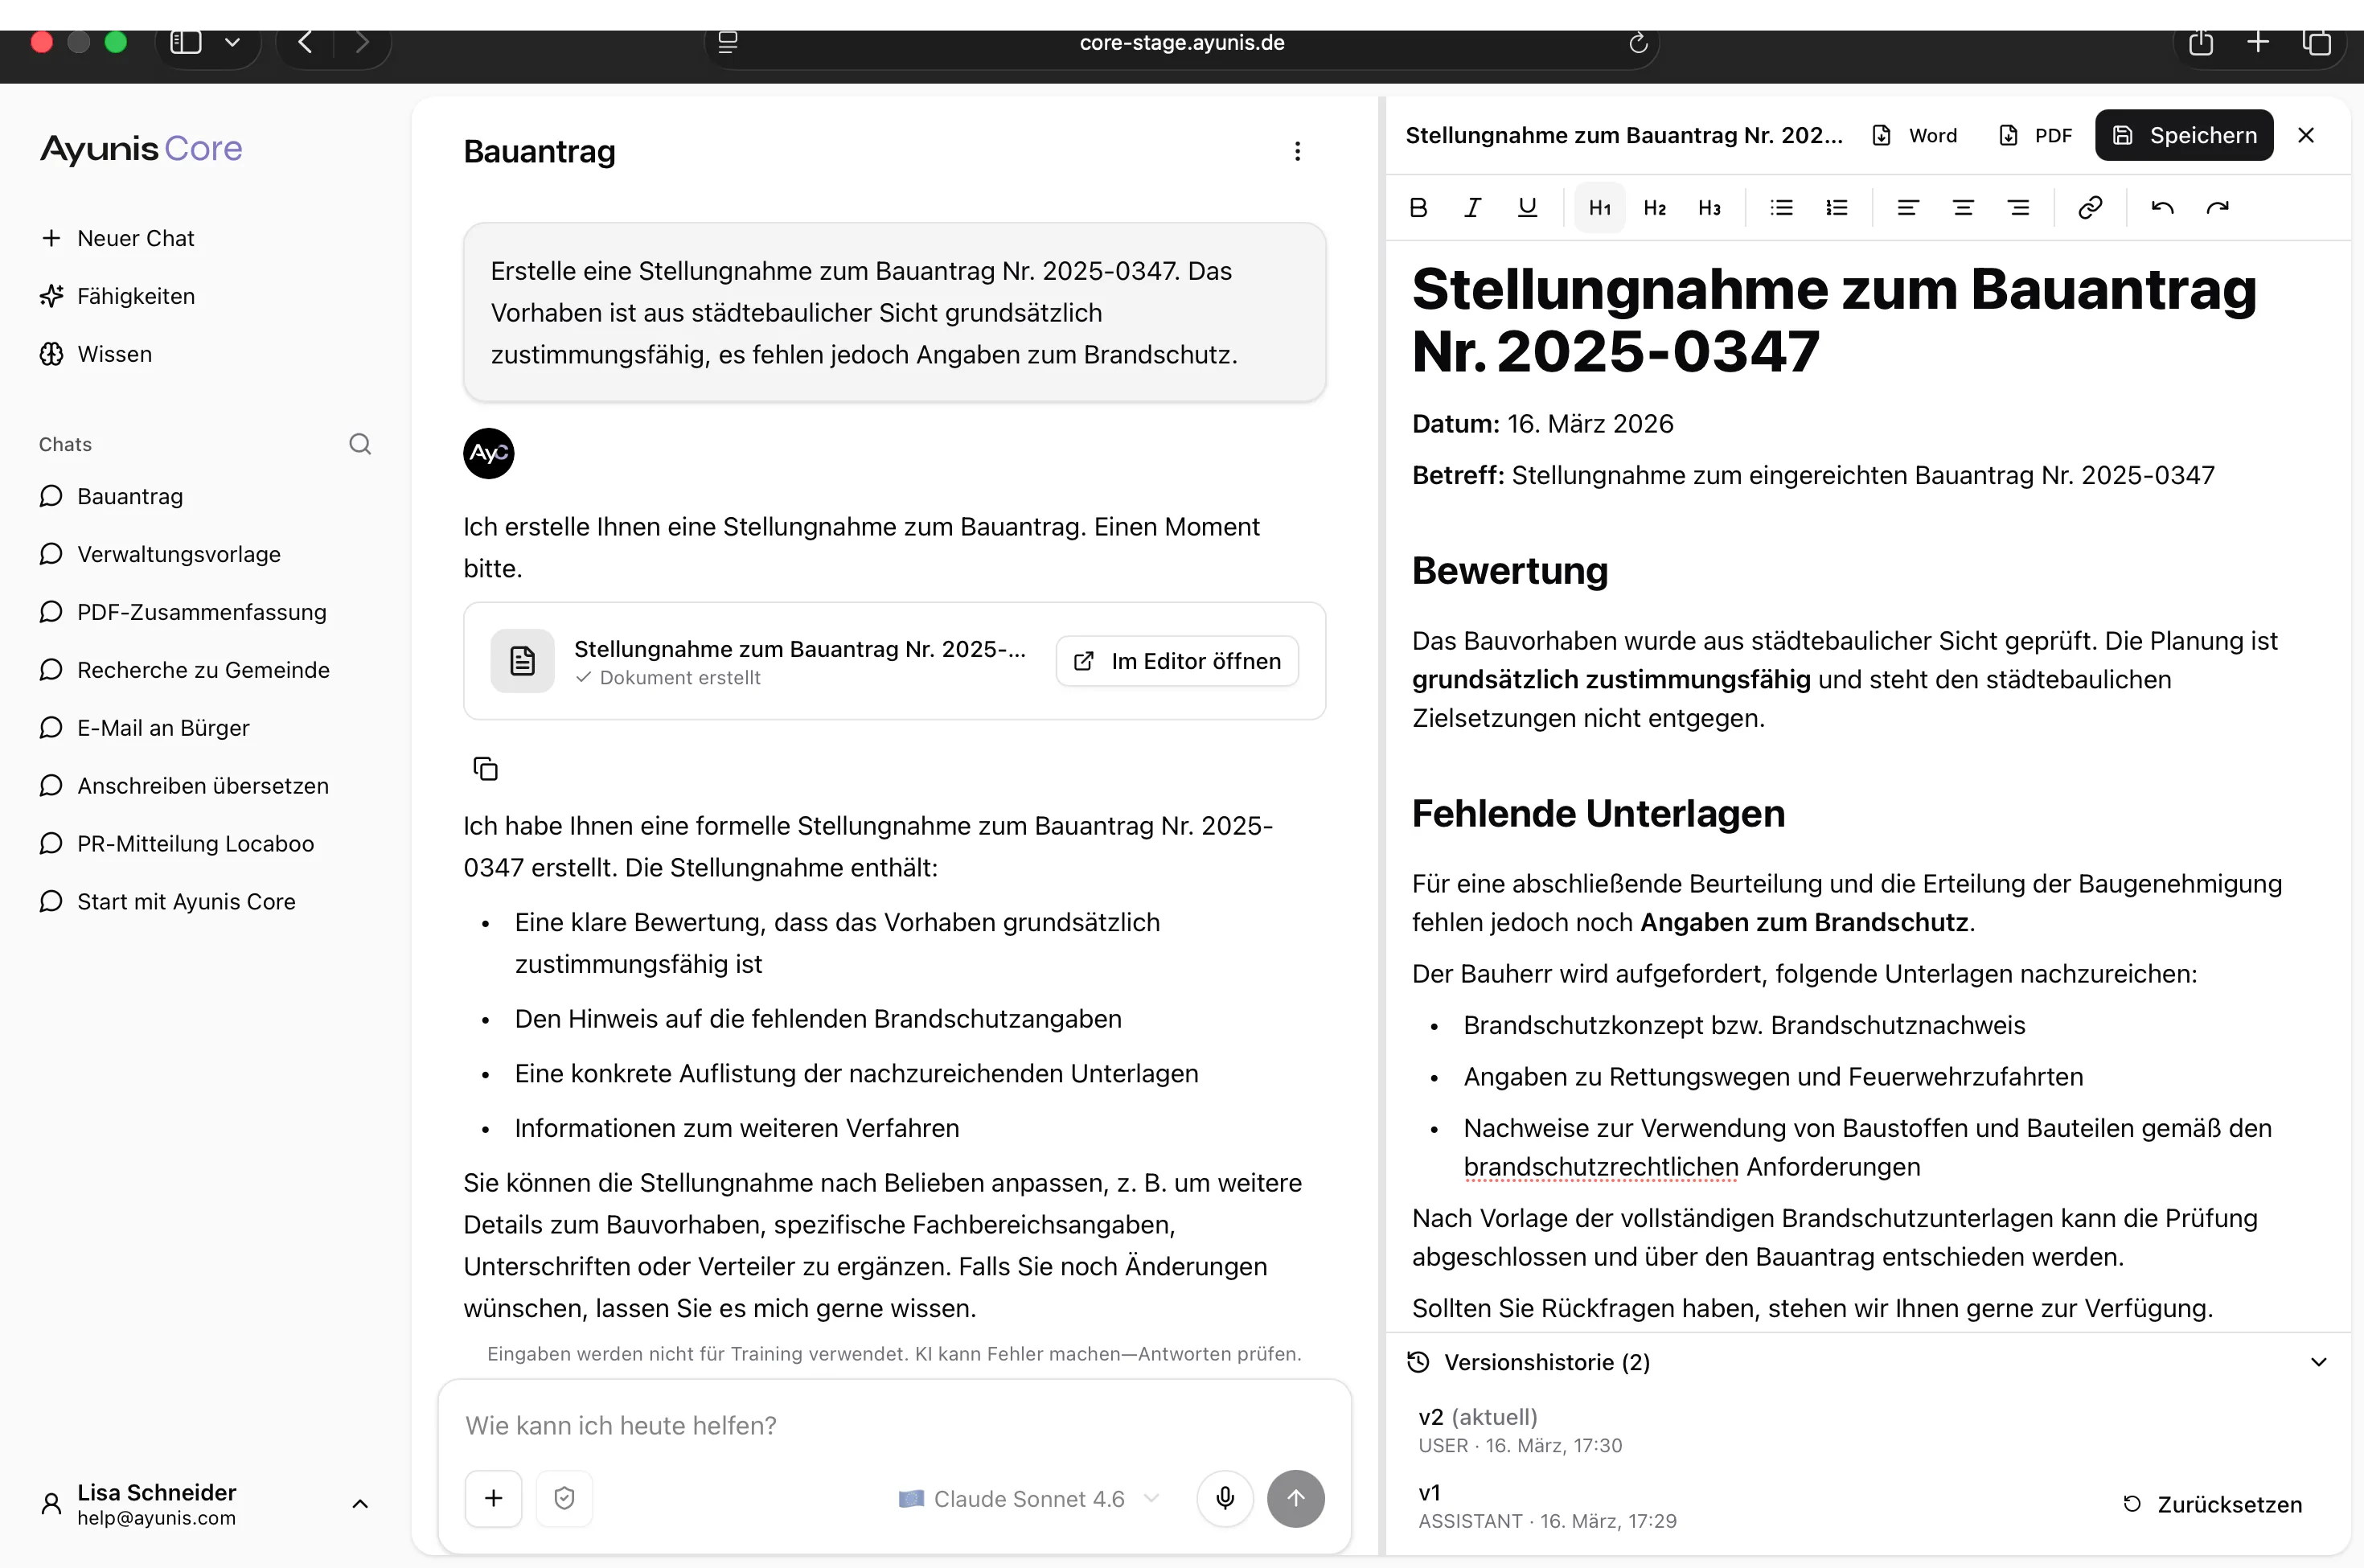
How to Open the Editor
Section titled “How to Open the Editor”- Send a message in the chat that generates a document – e.g., “Create a brief description of our project”
- The AI creates the document and displays it in the chat
- Click Open in Editor
The Editor opens as a side panel to the right of the chat.
Editing a Document
Section titled “Editing a Document”You can freely edit the text in the Editor. The formatting toolbar offers the following options:
| Feature | Description |
|---|---|
| Bold, Italic, Underline | Text formatting |
| H1, H2, H3 | Headings in three levels |
| Lists | Numbered and bulleted lists |
| Tables | Tables generated by the AI are displayed with their full structure |
| Alignment | Align text left, center, right, or justify |
| Link | Insert a hyperlink |
| Undo / Redo | Undo or redo recent changes |
Exporting a Document
Section titled “Exporting a Document”Using the buttons at the top right of the Editor, you can export the document:
- Word – Creates a .docx file for download. Tables are exported with evenly sized columns so they display correctly in Word.
- PDF – Creates a PDF file for download
PDF Export with a Letterhead
Section titled “PDF Export with a Letterhead”If your organization has set up letterheads, a letterhead selector appears in the Editor. Select the letterhead you want – when you export as PDF, your document is placed directly on the letterhead, as if printed on official stationery. The first page and following pages can use different templates and margins.
Choose No letterhead to export the document without a background. Word export is not affected by the letterhead selection.
Letterheads are set up by administrators in the Admin Settings.
Saving a Document
Section titled “Saving a Document”Click Save to save the current version of the document.
Spreadsheets
Section titled “Spreadsheets”Ask the AI to create spreadsheets with structured data – for example, comparison tables, budget overviews, or planning lists. Spreadsheets support live formulas (just like Excel) and can be exported as Excel or CSV files.
How to Create a Spreadsheet
Section titled “How to Create a Spreadsheet”- Describe in the chat what data you need – e.g., “Create a comparison table of the three offers for office furniture with price, delivery time, and warranty”
- The AI creates the spreadsheet and shows a card in the chat
- Click Open spreadsheet to view and edit it in the side panel
Editing a Spreadsheet
Section titled “Editing a Spreadsheet”The spreadsheet opens in an interactive grid where you can:
- Edit cells – Click any cell and type to change its content
- Use formulas – Enter formulas (e.g.,
=SUM(A1:A10)or=B2*1.19) just like in Excel. Formulas are evaluated live and results update automatically - Add rows – Use the toolbar to add new rows at the bottom
- Add and manage columns – Add, rename, reorder (drag), or delete columns via the toolbar
- Delete rows – Remove the last row via the toolbar
Exporting a Spreadsheet
Section titled “Exporting a Spreadsheet”Using the download button at the top of the spreadsheet editor, you can export the data:
- Excel (.xlsx) – Creates an Excel file with all data and formulas preserved
- CSV (.csv) – Creates a plain text file for use in any application
Updating a Spreadsheet
Section titled “Updating a Spreadsheet”To have the AI modify an existing spreadsheet, simply describe the changes in the chat – e.g., “Add a column for the total including VAT”. The AI updates the spreadsheet and you can view the new version in the side panel.
Diagrams
Section titled “Diagrams”Ask the AI to create visual diagrams such as flowcharts, organizational charts, process diagrams, or mind maps. Diagrams are rendered as interactive graphics in a side panel.
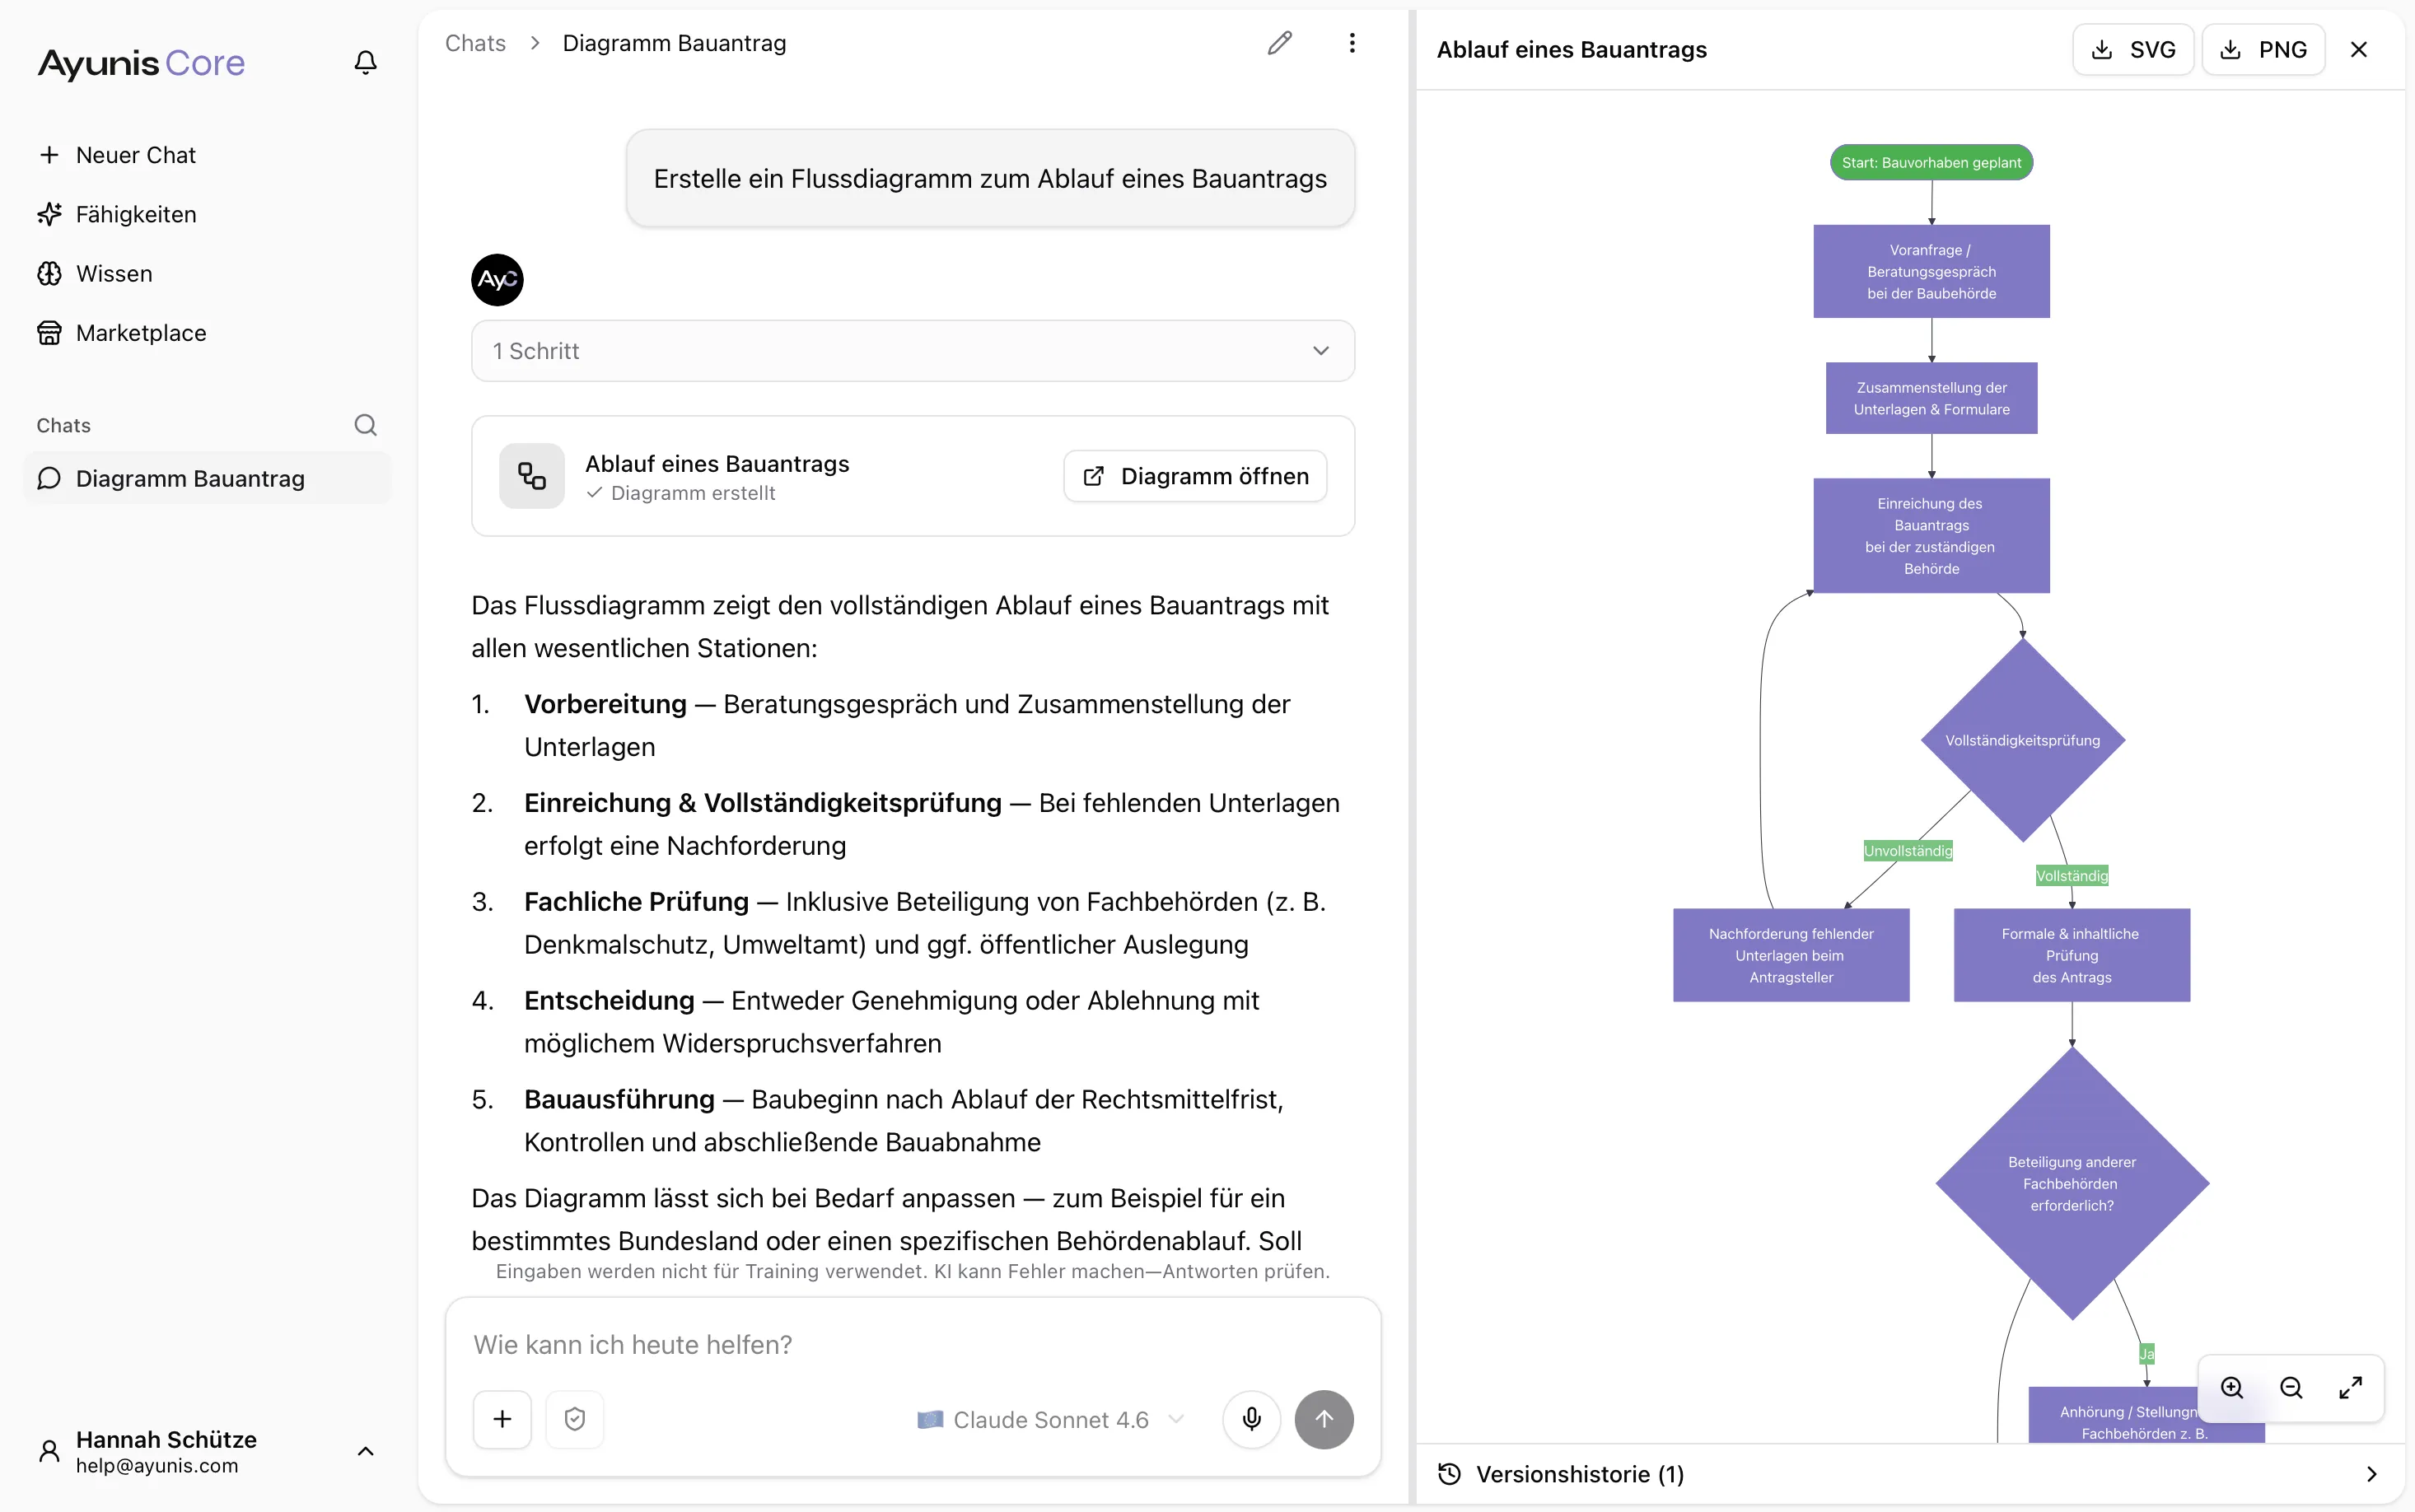
How to Create a Diagram
Section titled “How to Create a Diagram”- Describe the diagram you need in the chat – e.g., “Create a flowchart of our permit application process” or “Draw an organizational chart of our department”
- The AI generates the diagram and shows a card in the chat
- Click Open diagram to view it in the side panel
Viewing and Navigating
Section titled “Viewing and Navigating”The diagram viewer displays your diagram as an interactive graphic. You can:
- Zoom in and out – Use the zoom buttons in the bottom-right corner, or scroll with your mouse wheel
- Pan – Click and drag to move around a large diagram
- Reset view – Click the reset button to return to the default view
Exporting a Diagram
Section titled “Exporting a Diagram”Using the buttons at the top of the diagram viewer, you can export the diagram:
- SVG – A vector graphic that stays sharp at any size (ideal for presentations and print)
- PNG – A standard image file (ideal for embedding in documents and emails)
Updating a Diagram
Section titled “Updating a Diagram”To modify an existing diagram, simply describe the changes in the chat – e.g., “Add an approval step after the review”. The AI updates the diagram and you can view the new version in the side panel.
All Created Content at a Glance
Section titled “All Created Content at a Glance”Click the side panel icon in the top-right corner of the chat to open the Created content overview. It lists every document, spreadsheet, and diagram from the current chat – each with its title and type. Click an item to open it directly in the side panel.
This keeps you oriented when a longer conversation has produced several artifacts, so you don’t have to scroll through the chat history to find them.
Version History
Section titled “Version History”Documents, spreadsheets, and diagrams automatically keep track of different versions. In the Version History section at the bottom of the side panel, you can see:
- Which versions exist (e.g., v1, v2)
- Who created each version (you or the AI)
- When each version was created
Use Revert to go back to an earlier version if you want to discard changes.
- Generate first, then refine – Let the AI create an initial draft and then adjust it step by step
- Use versions – Save intermediate states before making major changes
- Export directly – Use Word/PDF export for documents, Excel/CSV export for spreadsheets, or SVG/PNG export for diagrams to share the finished result
- Be specific with diagrams – The more detail you provide (steps, connections, labels), the better the result
Practical Examples
Section titled “Practical Examples”Document: You need to write a statement regarding a building project. Ask the AI in the chat: “Create a statement on building application No. 2025-0347. The project is generally approvable from an urban planning perspective, but fire safety details are missing.” The AI creates a draft. You open it in the Editor, add the file reference number, adjust the wording, and export the finished document as a PDF.
Spreadsheet: You want to compare training providers. Ask the AI: “Create a spreadsheet comparing training providers A, B, and C with columns for price per participant, duration, location, and total cost for 15 participants.” The AI creates a spreadsheet with formulas that calculate the totals. You open it, adjust the number of participants, and export the result as Excel to share with your team.
Diagram: You want to visualize the steps in a building permit process. Ask the AI: “Create a flowchart showing the building permit process from application submission through review to approval or rejection.” The AI generates the diagram. You open it in the viewer, zoom in to check the details, and export it as a PNG to include in your presentation.